运行监控
在微服务系统中,我们需要时刻了解系统和服务的各种运行指标,更需要在出现问题的时候警报通知我们。因此,监控系统对于微服务来说是必不可少的。
爱星物联IoT云平台,后端采用微服务的技术架构,因此配备监控系统实时监测云平台的运行状态也是必不可少的。IoT云平台集成了市面上最为流行的监控工具是Prometheus。下面简要介绍下Prometheus特点、组件、部署及用法。
Prometheus
Prometheus 最初是 SoundCloud 构建的开源系统监视和警报工具包 。自 2012 年成立以来,许多公司和组织都采用了 Prometheus,该项目拥有非常活跃的开发人员和用户社区。现在,它是一个独立的开源项目,并且独立于任何公司进行维护。为了强调这一点并阐明项目的治理结构,Prometheus 在 2016 年加入了 Cloud Native Computing Foundation,这是继 Kubernetes 之后的第二个托管项目。
特点
Prometheus 相较于其他监控工具具有如下特点:
· 多维数据:Prometheus 是个时间序列数据库,支持由指标名称和键值对标识的时间序列数据的多维数据模型。
· 强大的查询:PromQL 允许对收集的时间序列数据进行切片和切块,以生成临时图形,表格和警报。
· 出色的可视化:Prometheus 具有多种用于可视化数据的模式:内置表达式浏览器,Grafana 集成和控制台模板语言。
· 高效存储:Prometheus 以有效的自定义格式将时间序列存储在内存中和本地磁盘上。通过功能性分片和联合来实现缩放。
· 部署简单:每个服务器在可靠性方面都是独立的,仅依赖于本地存储。用 Go 语言编写的所有二进制文件都是静态链接的,易于部署。
· 精确警报:警报是基于 Prometheus 灵活的 PromQL 定义的,并维护尺寸信息。警报管理器处理通知和沉默。
· 提供了许多客户端库:客户端库可轻松检测服务。已经支持十多种语言,并且也很容易实现自定义库。
· 提供许多集成:现有的 Exporters 允许将第三方数据桥接到 Prometheus 中。比如:系统统计信息、Docker、HAProxy、StatsD 和 JMX 指标。
· 支持通过服务发现或静态配置发现目标
· 通过 HTTP 的服务拉取时间序列数据
· 支持推送的方式来添加时间序列数据:这点在一些生命周期很短的服务中非常有用,比如:定时任务中,每个任务都很短,可能等不及拉取的时间,任务的 Pod 就已经 Completed 了,这个时候就可以使用推送的方式。
组件
Prometheus 生态系统包含多个组件,其中许多是可选的:
· Prometheus Server:用于抓取指标、存储时间序列数据
· Client Librarys:客户端库
· Pushgateway:支持短期工作的推送网关,以推送的方式将指标数据推送到该网关
· exporters:暴露指标让任务来抓
· alertmanager:处理报警的报警组件
· 各种支持工具
大多数 Prometheus 组件都是用 Go 编写的,因此易于构建和部署为静态二进制文件。
架构
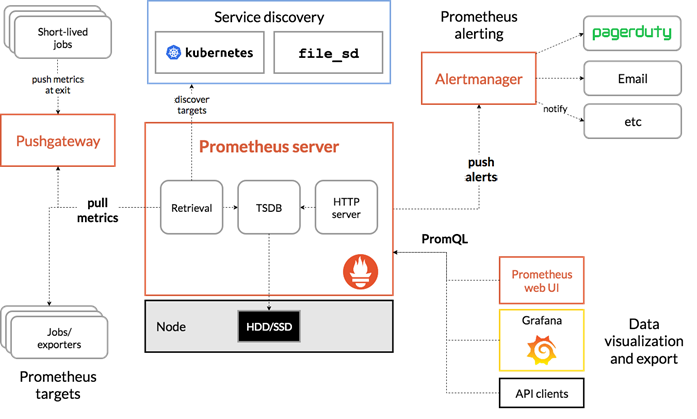
Prometheus 根据配置文件中设置的时间,直接或者通过中间的 Pushgateway 网关获取指标数据,在本地存储所有的获取的指标数据,并对这些数据进行一些规则整理,用来生成一些聚合数据或者报警信息,Grafana 或者其他工具用来可视化这些数据。
部署
为了熟悉 Prometheus 的详细工作流程,我们先在开发环境上搭建 Prometheus 和 Grafana,然后使用它们采集和展示一些指标。
ConfigMap
Prometheus 通过配置文件 prometheus.yml 启动。
#  prometheus.yml
apiVersion: v1
kind: ConfigMap
metadata:
  name: prometheus-config
  namespace: observability
data:
  prometheus.yml: |
    global:
      scrape_interval: 15s
      scrape_timeout: 15s
    rule_files:
      # - "first.rules"
      # - "second.rules"
    scrape_configs:
    - job_name: 'prometheus'
      static_configs:
      - targets: ['localhost:9090']
基本的配置文件包括以下三个模块:
· global:全局配置
· scrape_interval:抓取指标的频率,默认是 15s。
· scrape_timeout:评估规则的频率,这里也设置为 15s。prometheus 使用规则产生新的时间序列数据或者产生警报。
· rule_files:规则的位置,prometheus 根据这个配置加载规则,用于生成新的时间序列数据或者报警信息,当前我们没有配置任何规则。
· scrape_configs:配置监控的资源。
· job:prometheus 通过 HTTP 的方式采集 target 的指标。target 需要为 prometheus 暴露 /metrics 接口。特殊地,prometheus 也暴露了对它本身的监控接口。所以,在默认的配置里有一个单独的 job,叫做 prometheus,它通过 URL:http://localhost:9090/metrics 采集 prometheus 本身的时间序列数据 (包含状态和性能)。如果还有其他的资源需要监控的话,直接配置在该模块下面就可以了。
Deployment
接下来,我们准备 Prometheus 的 Deployment 文件。
# deployment.yaml
apiVersion: apps/v1
kind: Deployment
metadata:
  name: prometheus
  namespace: observability
  labels:
    app: prometheus
spec:
  selector:
    matchLabels:
      app: prometheus
  template:
    metadata:
      labels:
        app: prometheus
    spec:
      serviceAccountName: prometheus
      containers:
        - image: prom/prometheus:v2.19.0
          name: prometheus
          command:
            - "/bin/prometheus"
          args:
            - "--config.file=/etc/prometheus/prometheus.yml"
            - "--storage.tsdb.path=/prometheus"
            - "--storage.tsdb.retention=24h"
            - "--web.enable-admin-api" # 控制对admin HTTP API的访问,其中包括删除时间序列等功能
            - "--web.enable-lifecycle" # 支持热更新,直接执行localhost:9090/-/reload立即生效
          ports:
            - containerPort: 9090
              protocol: TCP
              name: http
          volumeMounts:
            - mountPath: "/prometheus"
              subPath: prometheus
              name: data
            - mountPath: "/etc/prometheus"
              name: config-volume
          resources:
            requests:
              memory: "1Gi"
              cpu: "100m"
            limits:
              memory: "2Gi"
              cpu: "200m"
      securityContext:
        runAsUser: 0
      volumes:
        - name: data
          emptyDir: {}
        - configMap:
            name: prometheus-config
          name: config-volume
rbac
因为 prometheus 需要访问 Kubernetes 的相关信息,所以还需要配置 rbac 认证。
# rbac.yaml
apiVersion: v1
kind: ServiceAccount
metadata:
  name: prometheus
  namespace: observability
---
apiVersion: rbac.authorization.k8s.io/v1
kind: ClusterRole
metadata:
  name: prometheus
rules:
  - apiGroups:
      - ""
    resources:
      - nodes
      - services
      - endpoints
      - pods
      - nodes/proxy
    verbs:
      - get
      - list
      - watch
  - apiGroups:
      - ""
    resources:
      - configmaps
      - nodes/metrics
    verbs:
      - get
  - nonResourceURLs:
      - /metrics
    verbs:
      - get
---
apiVersion: rbac.authorization.k8s.io/v1beta1
kind: ClusterRoleBinding
metadata:
  name: prometheus
roleRef:
  apiGroup: rbac.authorization.k8s.io
  kind: ClusterRole
  name: prometheus
subjects:
  - kind: ServiceAccount
    name: prometheus
    namespace: observability
Service
为了访问到 prometheus 服务,我们还需要创建一个 Service。
注:为了方便测试,这里指定 type 为 NodePort。
# service.yaml
apiVersion: v1
kind: Service
metadata:
  name: prometheus
  namespace: observability
  labels:
    app: prometheus
spec:
  selector:
    app: prometheus
  type: NodePort
  ports:
    - name: web
      port: 9090
      targetPort: http
部署
# 创建 observability 命名空间,用于存放 Prometheus 的部署
$ kubectl create namespace observability
namespace/observability created

# 部署所有文件

$ kubectl apply -f prometheus.yaml
configmap/prometheus-config created

$ kubectl apply -f rbac.yaml
serviceaccount/prometheus created
clusterrole.rbac.authorization.k8s.io/prometheus created
clusterrolebinding.rbac.authorization.k8s.io/prometheus created

$ kubectl apply -f deployment.yaml
deployment.apps/prometheus created

$ kubectl apply -f service.yaml
service/prometheus created
webui
访问
获取访问服务端口(31033)
$ kubectl get service -n observability
NAME         TYPE       CLUSTER-IP     EXTERNAL-IP   PORT(S)          AGE
prometheus   NodePort   10.98.133.13   <none>        9090:31033/TCP   44s
然后通过 http://localhost:31033 即可访问 Prometheus webui 服务。
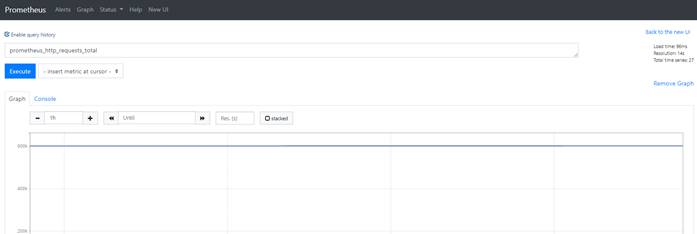
查看指标
输入并选择 prometheus_http_requests_total。选择 Graph,然后点击 Execute 即可以图形的形式查看指标 prometheus_http_requests_total 的具体数据。
那 prometheus_http_requests_total 这个指标是怎么加入到 Prometheus 的呢?
原因是在配置文件中配置了 Prometheus 自身的监控。而 Prometheus 自身在 9090 端口暴露了 /metrics 接口。所以,我们可以访问 http://localhost:9090/metrics 查看具体的 metrics。因为,我们使用 NodePort 暴露服务。所以,访问的地址变成 http://localhost:31033/metrics。
这里可以看到 Prometheus /metrics 接口中含有 prometheus_http_requests_total 指标,所以我们可以获取得到该指标的值。